
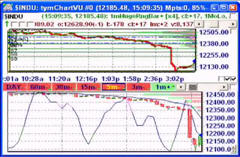
A good example of PRE-MOMENTUM trading.
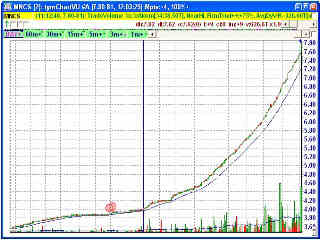
M&F WORLDWIDE (NYSE:MFW) trended so strongly today that I felt I just had to release a vlog to discuss the price action. The news out on MFW today is that it’s acquiring John H. Harland Company (NYSE:JH), a seller of printed products, software, and related services to the financial institution market. Normally when one company buys another, the acquiring company’s stock goes down in price. In this case, MFW traded higher, a move which was bound to throw off any traders caught short into a strong area of resistance. Add in that MFW’s stock float is a mere 12.3 million shares, with over 4% of the shares in short positions. We can always come up with many reasons for why a stock may go up or down. But how can we go about finding the best trading opportunities to pursue? Here, a 3/4 of a point gap up into multi-year high territory off the open on news that strongly holds its gains (on strong volume no less, relative to the stock’s average for the time) is a good start for a possible runaway gap. Add in the short interest and low float as fuel, and you’ve may just have yourself a race.
Once we’ve identified a candidate, what are the signs to watch for when determining what will happen next. Besides the fact that MFW showed almost no pullbacks throughout the entire trading day, we can be certain there was a strong buyer in the stock always ready to buy more stock as it became available. Perhaps the purpose was to force a short squeeze, or perhaps for some other reason as yet unclear. It really doesn’t matter so much as what is revealed by the tape and the price action. Also interesting to note was that at critical times when the buying pressure should let up and prices should fall back (according to the StochCCI indicator in my trading platform, tymoraPRO), we would see even more buying through the downward cycle, pushing prices even higher!
For those watch the depth versus time & sales. Each time you would see a large block of stock sitting on the offers, we would have a reprieve, albeit a very temporary one. The amazing thing is that traders would simply not sell out. Even if price dropped a dime it would be on very low volume and prices would quickly bid back up to the size at the offer. And each time, 13,000 share offers would be cleaned up in a blink of an eye, leaving your head spinning if you were caught short. The process repeated over and over again through the entire trading day, taking MFW from $19/share off the open to as high as $20.56 near the close (for a very strong close with follow-through potential). That’s about an 8% move climbing slowly and steadily with the beginning of a blowoff taking place with about 20 minutes to go in the trading day.
Stay away from the crazy trading stocks, and find those that are moving slowly and steadily where you’ve found a potential catalyst (or hey, why not three catalysts!). Then watch for a strong buyer to keep weighing on the stock and go along for the ride. If you can focus on just a few key moves a week where you can clearly define your risk upon entry, you should be set as a trader. You may also find it much less stressful than trying to trade a stock such as Google (NASDAQ:GOOG).
Notice the difference between a PRE-MOMENTUM move (previous day) versus a MOMENTUM move (current day).
Once we’ve identified a candidate, what are the signs to watch for when determining what will happen next. Besides the fact that MFW showed almost no pullbacks throughout the entire trading day, we can be certain there was a strong buyer in the stock always ready to buy more stock as it became available. Perhaps the purpose was to force a short squeeze, or perhaps for some other reason as yet unclear. It really doesn’t matter so much as what is revealed by the tape and the price action. Also interesting to note was that at critical times when the buying pressure should let up and prices should fall back (according to the StochCCI indicator in my trading platform, tymoraPRO), we would see even more buying through the downward cycle, pushing prices even higher!
For those watch the depth versus time & sales. Each time you would see a large block of stock sitting on the offers, we would have a reprieve, albeit a very temporary one. The amazing thing is that traders would simply not sell out. Even if price dropped a dime it would be on very low volume and prices would quickly bid back up to the size at the offer. And each time, 13,000 share offers would be cleaned up in a blink of an eye, leaving your head spinning if you were caught short. The process repeated over and over again through the entire trading day, taking MFW from $19/share off the open to as high as $20.56 near the close (for a very strong close with follow-through potential). That’s about an 8% move climbing slowly and steadily with the beginning of a blowoff taking place with about 20 minutes to go in the trading day.
Stay away from the crazy trading stocks, and find those that are moving slowly and steadily where you’ve found a potential catalyst (or hey, why not three catalysts!). Then watch for a strong buyer to keep weighing on the stock and go along for the ride. If you can focus on just a few key moves a week where you can clearly define your risk upon entry, you should be set as a trader. You may also find it much less stressful than trying to trade a stock such as Google (NASDAQ:GOOG).
NOTE: MFW exploded higher again off the next morning’s open to as high as $23.65 within the first half-hour of trading (the morning after this vlog was recorded)!
Notice the difference between a PRE-MOMENTUM move (previous day) versus a MOMENTUM move (current day).

tinyurl:
tinyurl:
Tags: explosive, john h. harland company, low float, m&f worldwide, nasdaq:goog, nyse:jh, nyse:mfw, short interest, stock market, stocks, trading, trending, trends, tymorapro

1 Comment »
 RSS feed for comments on this post. TrackBack URL


Great, now what about this buyout , like today and they want to buy media, real state. Where this money is coming from?