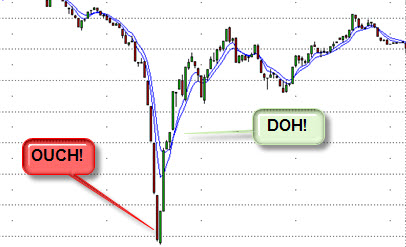
Was the May 6th, 2010 intraday crash and recovery just another one of those once-in-a-lifetime rare anomalies -– a rare confluence of events coming together to form the “Perfect Storm”? And if a “Perfect Storm” generally occurs so infrequently, why does it seem that we are presented with a newsworthy “Perfect Storm” in the markets on an almost regular basis? With all the misinformation and outrageous reasons the media and its “pundits” offer, perhaps it’s time to revisit exactly how markets work, and what (or who) may be to blame. It’s a lot easier to blame a “fat finger” or some naughty short-sellers for a huge market-selloff, than to accept that markets do not always have a buyer for every seller. Very simply, when a large number of market participants decide they all must sell (or buy) at the exact same time, an “air pocket” of price action will form. Anyone who has traded a market knows that this type of single-sided liquidity “crisis” occurs every day in the markets to various extents, especially after significant news events are released. While these relatively smaller moves may not be nearly as significant as a 1000 point intraday drop and overall market selloff, the dynamics are more or less the same. The setup develops with a large number of market participants all thinking the same way (ie. very strong bullish or bearish sentiment), generally due to a strong extended trend in a market. When the market finally turns, the large group of participants on the wrong side of the trade all decide to reverse course at the same time, at similar stop levels, just to save their leveraged hides. Does the trading term “slippage” ring a bell?
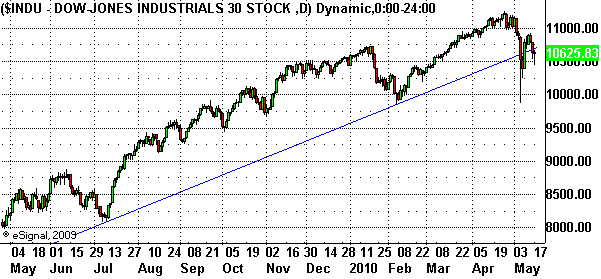
Looking closer at what occurred on May 6th, 2010, we see that the market trended upward for over a year. When key longer-term trend support levels were quickly breached on heavy volume, many buy-the-dip traders and investors were caught with their pants down. Add to this all the other investors who may have also entered the market at various lower levels over the past year, and whose primary goal was to preserve the profits they had made to date. Since these days most traders seem to be chart readers, they all likely placed their stops around the same price levels. With no one left to step in and buy, a huge void was created, “slippage” went through the roof, and prices collapsed to a level that would once again comfortably attract buyers.
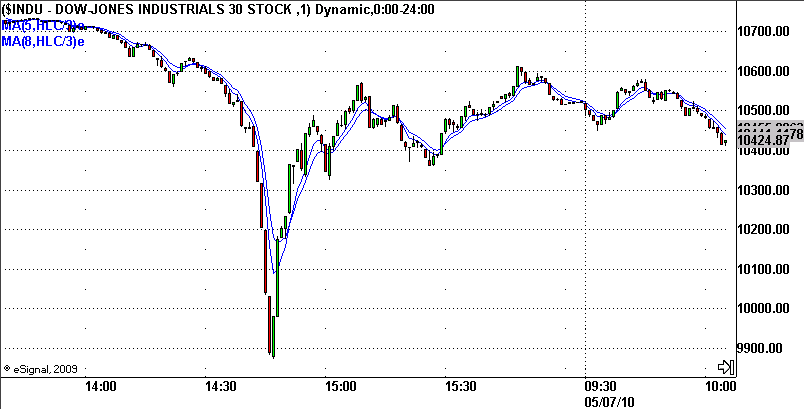
The market had already been trending downward the whole day. A simple crossover of the 5/8 EMA on this 1-minute chart (a 3min or 5min chart would have worked too) could have helped an astute trader capture the bulk of the move.
Generally, markets consist of millions of participants, all acting in their own self-interest to maximize their profits with different strategies over many different time-frames. When a crash occurs, a large number of participants (which up to that point had provided market liquidity), all decide to sell at the same time. Others may simply decide to pull out of trading altogether due to the wildly expanding volatility (thus further removing liquidity by providing no bid support at any price). A void is created wherein prices collapse to a level that can once again attract cautious buyers, and give them enough confidence to believe that there is great value in purchasing at much lower, yet still seemingly risky price levels (risky due to the recent panic/capitulation event).
So, if liquidity plays such a key role in providing market stability at any given time, is there anything that could be implemented to reduce the odds of such events occurring? There could be, if rules and policies were set in place to increase confidence and reduce barriers to those who could increase and diversify the market’s liquidity pool. Functionally, one idea could be for exchanges and Alternative Trading Systems (ATSs) to convert market orders to limit orders that follow, yet do not exceed, the current low print of the day (or high print of the day for melt-ups). This could dramatically reduce horrible fills way above or below the current market by panicked market participants who recklessly toss in market orders instead of limit orders on less liquid exchanges (ie. all the broken 1 cent executions you’ve undoubtedly heard about). Confusion over these wild trade executions also causes more stops to be hit, and instills even further panic among market participants, creating a cascading effect. Better interoperability between ATSs is a possibility too (ie. checking elsewhere for higher bids at market extremes), though in the past frequent stale quotes and stuck orders between systems have caused more problems than they solved.
Unfortunately, however, most of the policies implemented by the government or suggested by politicians have the exact opposite effect – they serve to reduce investor confidence and market liquidity. For example, when the House Subcommittee on Capital Markets, Insurance, and Government Sponsored Enterprises recently held hearings on the collapse, Brad Sherman (Dem., Calif.), asked whether High-Frequency Trading (HFT) should be limited, taxed, or “do we benefit from enormous quantities of money moving in and out of stocks for a few minutes? Is it a necessary part of allocating capital to real businesses? Or is it a parasitic attachment that lets some smart people with fast computers take some part of profit that should go to investors and allocate it for themselves?” Ironically, black boxes may very well be the market’s greatest short-term liquidity providers, and that is what preliminary findings are discovering. Gary Gensler, head of the Commodities Futures Trading Commission, stated that “Somewhere starting around 2:40pm, high-frequency traders started to limit their activity.” He noted that another factor may have been one large participant initiating a single large transaction in the S&P e-mini contract. Low liquidity + High Volume = Melt-ups (ie. short-squeezes, market spikes) or melt-downs (ie. crashes). Mary Schapiro, head of the SEC, did note that on May 6th short-selling was lower than usual, so it was not considered a big issue in the collapse. Actually, it may have been part of the issue, but not in the way you would think. Fewer short-sellers to BUY BACK their positions as prices collapsed = LESS liquidity = MORE collapse. Short-sellers add liquidity, especially in panics! Who else would step in front of an avalanche of selling and buy except for someone looking to lock in a profit. And in reality, High-Frequency Traders (HFTs) have essentially replaced market makers and specialists as the primary liquidity providers in the fully electronic world of trading. But telling that to politicians always seems to fall upon deaf ears. When markets go down, it’s easier to make exciting headlines by blaming short-sellers and HFTs. The media, however, rarely mentions how often short-sellers get their heads handed to them in massive short-squeezes on days when some stocks, especially lower-priced, less liquid stocks, go up 100% or more.
Want to increase liquidity? If so, regulators should make markets accessible to more traders. Drop the extremely limiting and useless pattern-day trader rules, and further limit exorbitant real-time data fees charged by exchanges (it costs multiples more to access the data than it does to receive it). Why have futures exchanges often provided free real-time data on new contracts? To attract liquidity! Reward short-term traders for adding to market liquidity, perhaps by MINIMIZING taxes on short-term gains (less taxes equals more incentive to trade versus the risks incurred). In addition, the more level the playing field, the more liquidity the markets will attract. Good regulation should provide increased competition, more transparency, and more fairness. For example, regulators should make sure that HFTs are not front-running their own customers’ orders (if the firm is in a position to do so). Regulators should also eliminate “flash orders”, which are permitted by a regulatory loophole intended for specialists that allows exchanges to show orders to some traders ahead of others for a fee. The difference is that specialists were offered that privilege since they were required to step in as buyers of last resort (adding liquidity in times of panic), whereas HFTs that exploit this privilege are not so required.
The possible solutions being offered, however? Referring to High-Frequency Trading, Sherman asks “Why are we allowing this activity to take place? Does it serve a real purpose?” He asks if traders should be asked to hold securities for a couple of hours! Obviously, these people have absolutely no understanding of how markets work and the importance of LIQUIDITY. Sorry Mr. Sherman, I can’t buy your PG shares right now at $60, but I’d be happy to try again when I am legally allowed to later on at $45! Liquidity balances markets, reduces “slippage”, and tightens spreads (the amount you lose if you were to immediately buy then sell the same security). Any rules or policies that impair liquidity (except for limiting the use of excessive leverage, especially overnight) undermines confidence in a market, and enables outsized moves such as this to occur. Members of Congress were even asking about seeing the source code used by some of the largest algorithmic HFTs. If this code was leaked, the code would become all but useless (and in fact dangerous to use as other participants would quickly learn how to take advantage of their flaws).
And imagine if Congress passed a .25% “transaction tax”. That would all but wipe out most traders’ ability to profitably trade and add more diversified liquidity to the markets. How about trading halts for large moves down? For anyone ever caught on the wrong side of a trading halt, has it ever increased your confidence, or did it give you even more reason to panic? Halts cause more panic because participants who are trapped can’t get out. The pressure by those looking to dump positions builds up over time, and when trading finally resumes, this pressure will now tank the market in the form of a giant gap until buyers find a level where they are comfortable enough to return. If you are going to halt a melt-down, how about halting a melt-up? Will it be okay for a stock to run up 100% one day, but then get halted the next as it falls back to a “more realistic” down 25%? Just a few more great ways to dramatically reduce both liquidity and confidence in the markets.
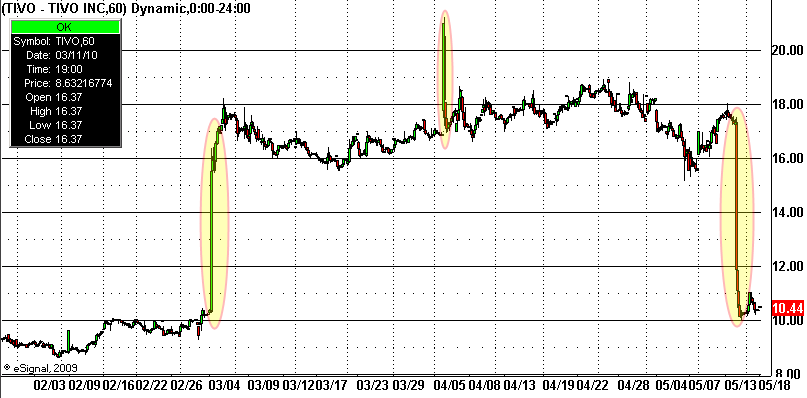
One positive step is that the S.E.C. has finally proposed to implement a uniform trade bust (broken trade) policy, including time limits for the busts to occur (ie. not hours or days after the fact). Imagine if in a panic you book a windfall profit by buying a block of stock at $33 then soon after selling it at $38/share. Several hours later, with the stock now at $45+, you are told your buy at $33 is busted. Your windfall profit is now a huge loss that could very well wipe you out if you were heavily leveraged. If you do ever get a “too good to be true” fill, it’s always safer to leave the trade open just long enough to be certain that the execution will not be busted. The S.E.C’s move regarding busted trades is the kind of transparency and clarity that will lead to greater confidence and liquidity. Traders will have a much better idea as to which trades may be busted (especially in a panic) so that they can better adjust and position themselves accordingly in a timely manner.
So, on a more practical note, as traders what can we learn from this experience to further improve our skills, and possibly better protect ourselves from being caught on the wrong side of such moves? First off, those who were wiped out or hardest hit were most likely heavily margined traders caught on the wrong side of the down, or subsequent up move. Traders who ignored the day’s price action and repeatedly tried to bottom-fish the market or catch a falling knife (again, especially on heavy leverage) were also punished for it. Traders who were patient, prepared, not worried about blowing out an overleveraged account, and open to the opportunities presented by price-action on the tape had a chance to rake in some serious coin on this month’s once-in-a-lifetime “Perform Storm” opportunity.
Ironically, it’s healthy for crazy market moves such as this one to occur from time-to-time. It reminds traders and investors to “keep it real”, to avoid becoming complacent as anything can happen at any time, and to always practice sound risk management. Has anyone learned anything from the housing subsidies and manipulations that helped inflate the multi-decade long housing bubble and its subsequent collapse? If you are forced to sell, it really doesn’t matter what something’s worth, but what someone’s willing to pay for it that instant. Those traders and investors who had extra cash on hand, and were not leveraged to the hilt found opportunities abound if they were fast enough to grab just a few of them.
Always keep in mind that you have no control over what the markets will do. What you can control, however, is your patience, discipline, risk-management and position-size (to adjust for volatility and worst-case loss scenarios). Seasoned traders also tend to use leverage sparingly. If they do use it, it’s generally for shorter-term intraday positions and scalps, not for longer-term positions with tough-to-game overnight news risk (unless you’re a bank with a bailout line at the Fed). The larger the timeframe you’re trading, the greater the chance things can go wrong. And always consider the possibility of an occasional trade halt, especially with biotech stocks.
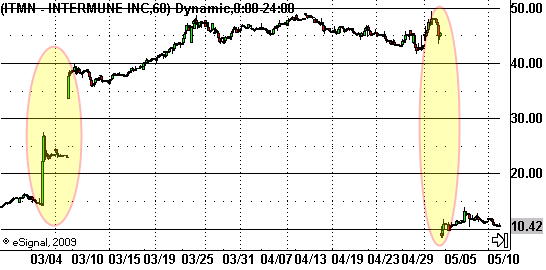
Imagine if you had just bought 500 shares of Intermune (NASD:ITMN) before it was halted at 12:45pm on May 4th, 2010. Pre-halt, ITMN sold for $45/share. Post-halt, it traded down below $8.50/share before bouncing slightly. If you had been caught with 500 shares of this stock, you would have lost upwards of $18,000. Now imagine if the government implemented a 10% daily down (or up) limit on stocks (another silly idea that has been proposed). Won’t you feel better that it took you an agonizing few week’s worth of 10% limit down days before you could finally determine your total loss? While some traders may have been aware of the FDA’s pending decision, perhaps you were not. It also pays to learn and understand as much as you can about a stock before trading it. That in itself can provide you with a significant edge while other traders are running around with their heads chopped off. Be aware that biotech stocks are known for crazy short-squeezes or huge price crunches based on how trial results are interpreted or how the FDA rules on their drugs. Adjust your risk, size your positions accordingly, and always consider worst-case scenarios for the type of assets you are trading.


 RSS feed for comments on this post.






I predict this can come out better than any are predicting. We don’t want to jinx it when you are overly optimistic and the media want to lower our expectations to be able to suppress the vote.