Back in February 2009, with the markets plunging relentlessly day after day, after day… I still recall how many traders were waiting in anticipation for some sort of crazy, panicky, high volume day to mark a capitulation bottom. This latest market downswing took the DOW down nearly 30% in just over two months from 9,088 to a low of 6,470 on March 6th, 2009.
Many traders whose market analysis and insights I respect seemed to be waiting for some massive “fireworks”-type event that would all but shout “THE LOW IS HERE”; a sign that all the weak hands have most likely thrown in the towel, and that it was now time to BUY BUY BUY hand over fist.
Of course, Mr. Market will never make it quite that easy, even for its smartest participants to figure out what its current “jig” will be. The DOW closed below 6,700 for several days before breaking out higher and closing above 6,900 on March 10th, 2009 on a bit higher average volume. It also marked the first day since this leg of selling began in early February that the DOW was able to close above its downward-sloping trend-line. However, that super-charged high volume capitulation day we were all looking for and expecting to occur never materialized. While in September and October 2008 the VIX volatility index hit highs just over 80, in February and March 2009 the VIX topped out in the low 50’s. This peak was 35% lower than its earlier spikes, even though the market was now trading at lower price levels.


![]()
Traders who were set in the idea that the market had yet to put in a final massive capitulation saw this quick move off the lows as another great shorting opportunity. However, as the market began to steadily rise day after day, more traders realized that the bottom (at least for now) was likely behind us. Those who did not keep an open mind and adapt their thinking continued to look for the market to roll over once again. Some traders even increased their short positions while clinging to the idea that the capitulation bottom they were expecting would soon materialize. Needless to say, they paid dearly for it.
I have long been a student of market behavior, mass psychology (or perhaps I should say mass psychosis), and price action. While I have observed this type of behavior in the past, it disturbed me that I couldn’t quite piece together why this debacle completed its course in such a relatively quiet and unassuming way. Certainly, after such heavy multiday liquidation, it seemed almost necessary that at some point everyone left would throw in the towel and say, “I’ve had enough”! I thought about this for a long time, and remained on the lookout for any insights that could help me better understand the market dynamics that were in play at the time.
Recently, while re-familiarizing myself with an old 1931 trading classic, “Tape Reading & Market Tactics” by Humphrey B. Neill, I found my answer in chapter 5 – and it hit me as if I had just walked into a brick wall:
“Many factors must be taken into consideration when we are interpreting the volume of turning trends. For example, the volume on June 18, 1930, which marked the approximate bottom of a severe decline, was 6,000,000 shares. At the end of the decline in August, 1930, owing to the decrease in the number of active margin-accounts, the selling climax came with only 3,400,000 shares traded. I well remember that day, because I was short of the market, and was trying to decide whether there was sufficient volume to mark the turning point or whether the selling was likely to carry much farther. However, the action had many of the ear-marks of a “clean-out,” of a temporarily oversold condition. Although there was a terrific churning of stocks, little headway was made for approximately three hours. There was no progress on heavy volume. That was our signal.
However, when the market temporarily reversed its trend later in the year, in November, following a decline which had continued steadily for fifty-one days, we did not have the big volume day. Why? Because margin accounts with brokers were at the minimum; brokers’ loans were down to the lowest on record. Actual liquidation had gone on for weeks. Liquidation from strongboxes and necessitous selling by large interests are not dumped upon the market as are stocks held on margin by the public. [emphasis added] (The speed of the crashes in the fall of 1929 was caused by this panicky dumping of margined stock.) Therefore it was necessary to estimate the extent of liquidation already accomplished and to wait for the signs of the turn.”
There was the answer in black and white. First Neill lays out the scenario, which in this case took place about a year after the 1929 crash: “following a decline which had continued steadily for fifty-one days, we did not have the big volume day.” The reason? Because most of the weak hands, along with most of those trading on margin, were largely wiped out in the earlier market panics. As Neill states, “The speed of the crashes in the fall of 1929 was caused by this panicky dumping of margined stock”. This last move was steadily fueled by heavy liquidation day after day for 51 days, and this time around it was the professionals, the institutions, and the market specialists (the strongboxes and necessitous selling by large interests) that were “throwing in the towel”. Institutions holding huge positions in stocks could not throw out their positions using market orders all at once even if they wanted to. They are forced to sell a bit at a time, day after day, in a very meticulous and controlled fashion.
This sounds like what must have unfolded in February and early March 2009. The remaining “smarter” participants and the “big money” funds were liquidating their positions. Mutual funds and hedge funds meeting redemptions, risk managers raising cash and reducing risk, pension funds hoping to preserve some semblance of value, you name it. When big money throws in the towel (so long as the liquidation is not the result of heavy margin selling) it will almost always (and generally by necessity) be a slow, steady, and controlled liquidation process. The turning point will materialize once the heavy selling subsides, and the market finds stability at a price level that once again attracts accumulation by strong-handed buyers.
The book was right on, and I recommend anyone serious about trading to revisit this old classic trading book, as the most valuable market insights are truly timeless. In retrospect, I have observed variations of this pattern unfold many times (even intraday), and have often sought to use it to my advantage. On a larger scale, it is especially noticeable with public companies that receive massive news coverage over highly emotionally-charged issues. Think Toyota Motors (cars driving themselves) or British Petroleum (massive gulf oil leak). One minute, thousands of new headlines and commentary a day. A few months later, nary a mention. Swine flu, anyone? But I digress…

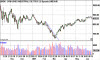
Take the above example from Toyota Motors (NYSE: TM). You can clearly see the height of the media coverage and outrage into the issues revolving around “sudden acceleration” of Toyota cars into early February 2010. Volume well exceeded 10 times its normal average on that last day of panic selling. The first move off that low runs right into downward resistance before turning back down, albeit on much lower volume. In addition, while implied volatility in TM nearly doubled at 44% into the early February down move, it topped out around 37% the second time around before sharply reversing and breaking above the downward trend line on a closing basis. As a side note, notice how the trend line I chose was the least “steep” I could draw (indicating reduced downward momentum). While TM move lower later in the year, it did recover to nearly $82.50 before rolling over.

British Petroleum PLC (NYSE:BP) is another good example. By the end of June, when all the weak hands, the bargain hunters, and the margined players were out of the picture, BP went on to make another new low, taking out anyone left who had not yet thrown in the towel. This new low occurred on much lower volume (as well as on lower option implied volatility) than other recent panic lows that took place on heavy selling. Once BP’s stock closed back above $30/share, breaking its key downward trend line resistance, it fueled a powerful 35% move back up before finding support around the $35/share level.

As a final example, notice the large volume spike that took place in Boeing (NYSE:BA) in late June 2009 when fears again materialized regarding more delays with Boeing’s new 787 jetliner. Notice how the final low again took place on much lower volume as compared to the initial panicked selloff that took place. As with the other examples, implied volatility on BA options was also lower this time around. As price broke above its downward trend lines, BA staged an impressive recovery for a stock that no one seemed interested in at $40/share.
When markets top, they often go out with a roar once “everyone wants in”. Likewise, markets will often find a bottom once everyone’s thrown in the towel, given up, and lost interest. I suppose we can sum it up by saying that more often than not, “markets will top out with a bang, and bottom out with a whimper”.

 RSS feed for comments on this post.